Common menu bar links
Science behind the Harbour

Diagram showing how oceanographic and marine geological information is collected at sea using a variety of ship mounted and towed devices.
To map the geology and seabed of Halifax Harbour two main techniques were used. Firstly, ship surveys were conducted in a grid pattern with systems that use sound or acoustics (seismic-reflection profilers, echosounders, and sidescan sonars). These systems provide data and images that can be interpreted to understand seabed and subsurface bedrock and sediments. They use sound energy to not only bounce off the seabed to determine water depth, but penetrate sediments and identify layering and other internal features. Some images provide a cross-section of the seabed and subsurface. Based on this information maps can be made of sediment distribution, sediment thickness, and geological features below the bottom.
Sidescan sonars are systems that emit narrow fan-shaped, high-frequency sound that does not penetrate the sediments, but sweeps across the seabed at low angles. It provides a plan-view image that resembles an aerial photograph. From these images, information can be extracted on sediment type and distribution, as well as the shape or morphology of the seabed. These systems are particularly good at revealing features on the seabed such as shipwrecks, anchor marks, cables, and other debris.

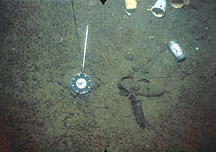
A bottom photograph of mud in the inner harbour and typical discarded material on the seabed. The small black features on the seabed are worm tubes.
The above surveys are called remote-sensing surveys because they are done from a moving ship. They are then followed by the collection of carefully positioned sediment cores (tubes that penetrate the sediments like a needle), seabed samples, and bottom photographs. This is called the ground truth for the acoustic (sound) images collected by the first systems and is used to confirm that the interpretations of the information are correct. During the final part of the survey, a remotely operated vehicle called an ROV was used to investigate individual targets or seabed features. Observations from submersibles were also undertaken in Bedford Basin, the outer harbour, and in the approaches to the harbour. All of this information was compiled in maps of the bedrock and sediments of the harbour. The sediments were mapped with formal names used by marine geologists for sediments, for example, the mud is called LaHave Clay and the sand and gravel in the outer harbour is called the Sable Island Sand and Gravel.
During the mapping of Halifax Harbour, studies of the geochemistry of the sediments were conducted at the same time. This provided information on the sediment history and the presence of contaminants. The results were used to unravel how people have used the harbour and surrounding areas.

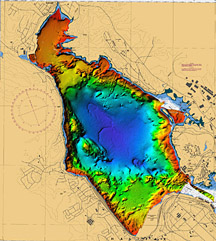
A multibeam bathymetric map of water depths in Bedford Basin. It is colour coded to depth with the deepest area in blue and 71 m deep. It is also shaded with a computer generated artificially sun that produces shadows and allows the image to be interpreted as an aerial photograph of land.
An important part of seabed mapping is understanding the shape of the seabed and the depth of water. Hydrographic charts are produced for this purpose by the Canadian Hydrographic Service. During the final survey stages of the harbour a new technology called multibeam bathymetry became available for high-resolution mapping. This system uses transducers (sound sources) mounted on a ship that produce many independent sound beams and can map a large swath of the seabed at one time covering 100% of the bottom. The images that are produced are computer shaded to look as if the water is drained and you are flying over the area. Many are used in this web site. They are the underwater equivalent of aerial photographs of the adjacent land. Because the information is collected digitally, many different kinds of maps can be produced to show subtle aspects of sediment deposition, erosion, and seabed features. The information can also be displayed using various colour schemes to represent seabed shape and as computer generated fly-throughs. The multibeam-bathymetric images nicely complement the other geological data sets.
This is a brief summary of the geochemistry of the harbour sediments conducted by Dale Buckley and colleagues of the Geological Survey of Canada (Atlantic). Beneath a thin layer of brown oxidized sediments, often less than a few millimetres in thickness, the muds of the harbour are grey to black with a hydrogen sulphide smell (rotten egg). The distributions of contaminant metals such as lead, zinc, lithium, cadmium, and copper in these muds have been studied and related to their sources. Distributions of copper and zinc show untreated sewage outfalls as major sources. Zinc anomalies adjacent to Seaview Point in Bedford Basin indicate leaching from the former location of the Halifax city dump.
A special analysis technique was used to understand the complex distribution of geochemical anomalies. This consolidated a vast amount of information and showed that four processes are responsible for contamination of the sediments. The two major ones are attributed to sewage and industrial discharge, and surface-water runoff.
The level of contamination of metals in the sediments of Halifax Harbour is among the highest in comparison with similar environments in the world. It is directly related to the sediment-trapping properties of the harbour. The sediments hold a large number and quantity of contaminants, but because of the anoxic (lack of oxygen) conditions in the immediate subsurface, they are partially confined; however, physical disturbance of the seabed by ship anchoring and propeller scour can mobilize the sediments.
In addition to studies of the metal contaminants at the seabed, sediment cores were studied to understand the history of contamination. The cores revealed like the pages of a book, for example, that hydrocarbon concentrations increased 100 times from 1900 to 1990. Mercury, zinc, lead, and copper peaked in the 1970s. Historical trends could clearly be detected. For example, sediments in Northwest Arm indicate a change from surface runoff to one derived from recent sewage discharge. These changes result from industrial and urban activities that alter the kind, quantity, and location of inputs to the system.

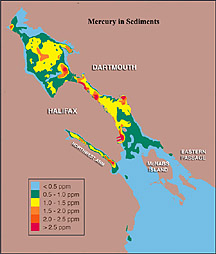
A map showing the distribution and amount of mercury in seabed sediments of Halifax Harbour prepared by Dale Buckley.
The dating of the cores also provided information on the sedimentation rates in the harbour since approximately 1880. For Bedford Basin, approximately 35 cm of sediment were deposited between 1880 and 1990, whereas the amount in the inner harbour, to the southeast of Georges Island is approximately 90 cm over the same period.
The maps of metals in sediments can also provide an indirect assessment of how and where sediments are likely to be deposited. In the inner harbour, the distribution of mercury from the sewage outfalls of the Pier A area of the south end of Halifax shows northward movement west of Georges Island with deposition north of Georges Island. A large mercury anomaly in southeastern Bedford Basin is attributed to outfalls in The Narrows at the foot of Duffus Street with transport to Bedford Basin and the eventual deposition where the current speeds reduce.
With few exceptions, the patterns of contaminated sediment transport show an overall inward movement to the north and this is supported by many other observations on seabed features.
